AI Analytics
YesBill Analytics gives you visual insights into your spending patterns and AI usage — powered by charts and AI-generated summaries.
YesBill Analytics
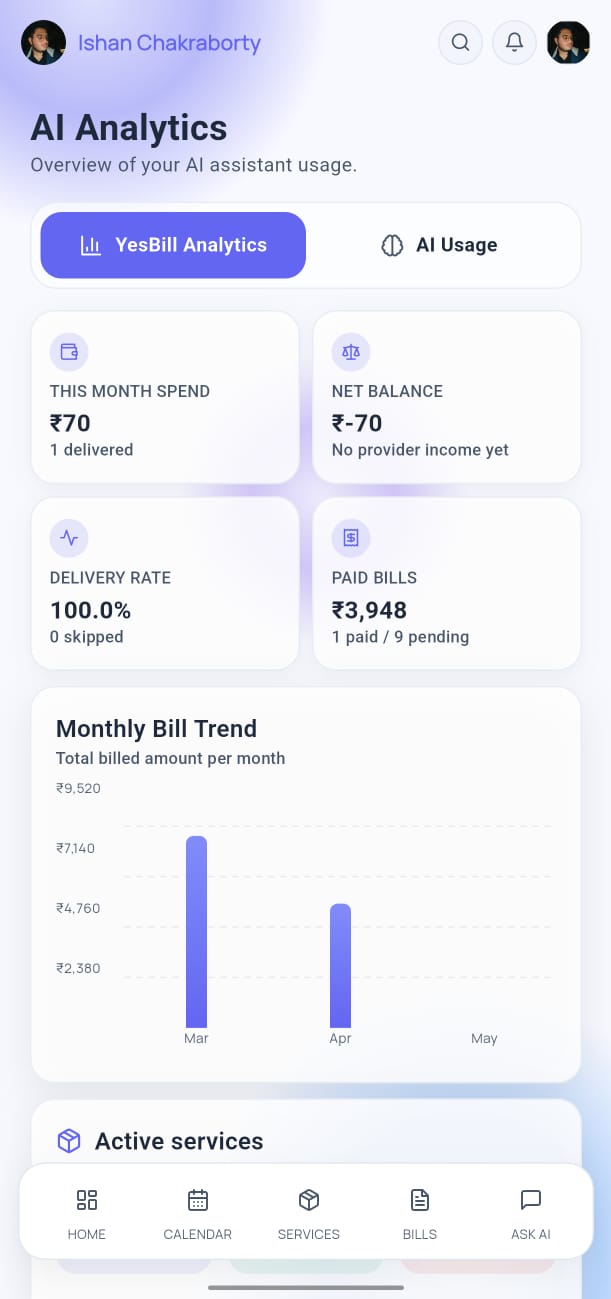
The YesBill Analytics tab shows your household spending data:
- Monthly Spend Chart — bar chart comparing spending across months
- Service Breakdown — pie chart showing which services cost the most
- Trends — AI-generated summary of your spending patterns and notable changes
AI Usage Analytics
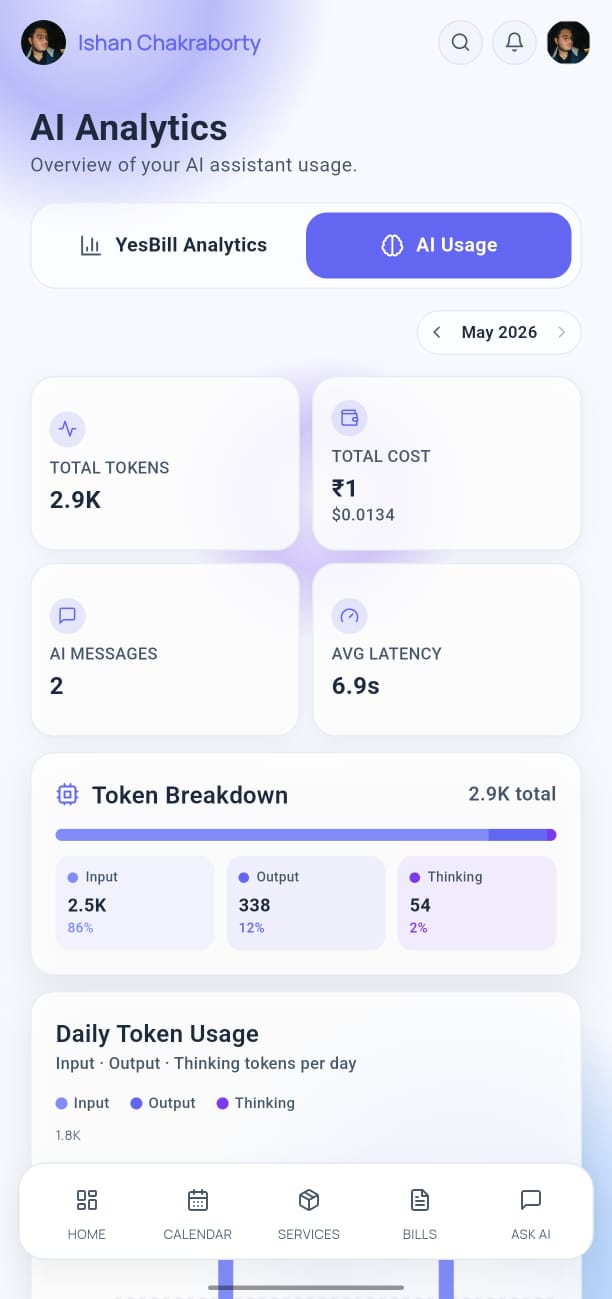
The AI Usage tab tracks how you're using the AI features:
- Total queries sent this month
- Queries per day (line chart)
- Token usage by provider
- Cost estimate based on your API provider's pricing
This helps you monitor your API costs, especially if you're on a metered plan.
Accessing Analytics
- Tap Ask AI in the bottom navigation bar.
- Tap the Analytics tab at the top of the screen.
- Switch between YesBill Analytics and AI Usage using the tabs.
Time Range
Use the date range selector at the top to change the analytics period:
- Last 7 days
- This month
- Last 3 months
- Custom range
tip
The AI-generated trend summary updates automatically when you generate new bills. For the most accurate insights, ensure your bills are generated and marked as paid on time.